Summary Widget
Introduction
The "Summary" widget is able to summarize data in the datasheet, and displays the summarization value with custom colors and labels.You can use it to display the summarization and target values of some key indicators, such as sales, the number of orders, the number of users, the number of bugs, etc.
Adding the widget
Method 1:
Open a datasheet, click the "Widget" button in the right corner of the view to expand the widget panel, and then click the "New widget" button.
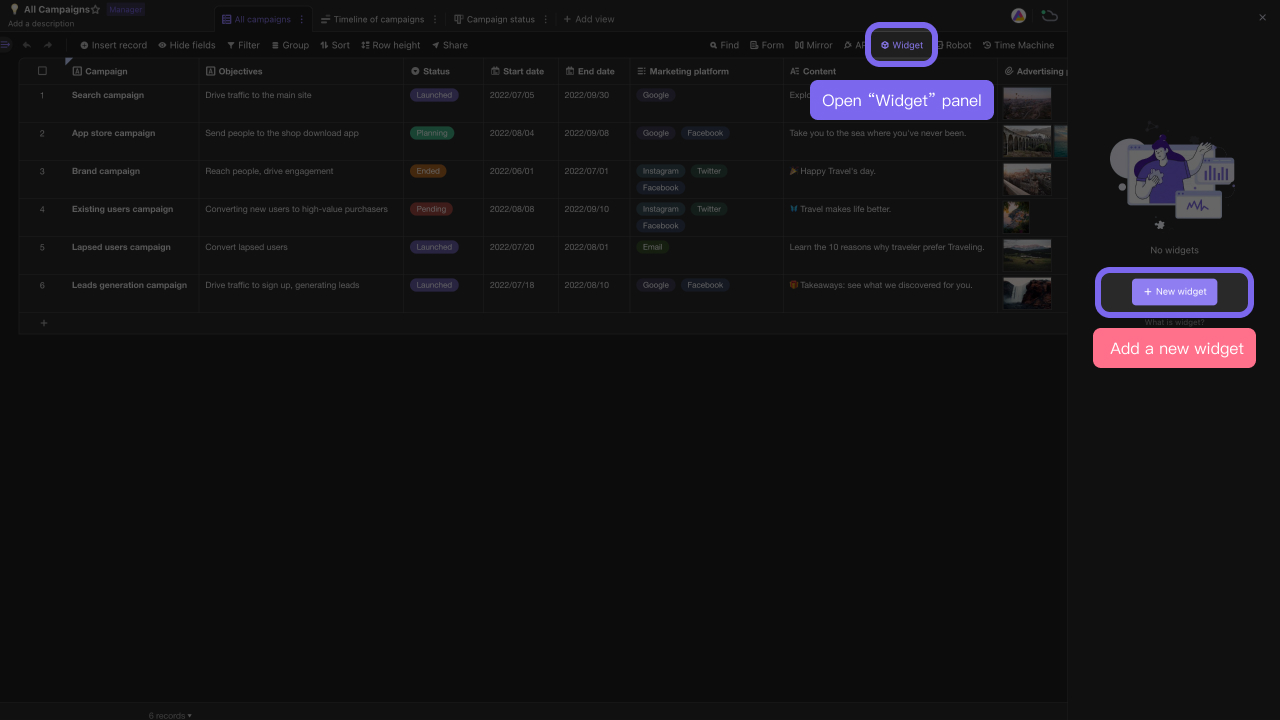
Click "Summary" appearing in widget center to add it.

Method 2:
You can also add "Summary" widget into dashboard by importing or creating a new widget:
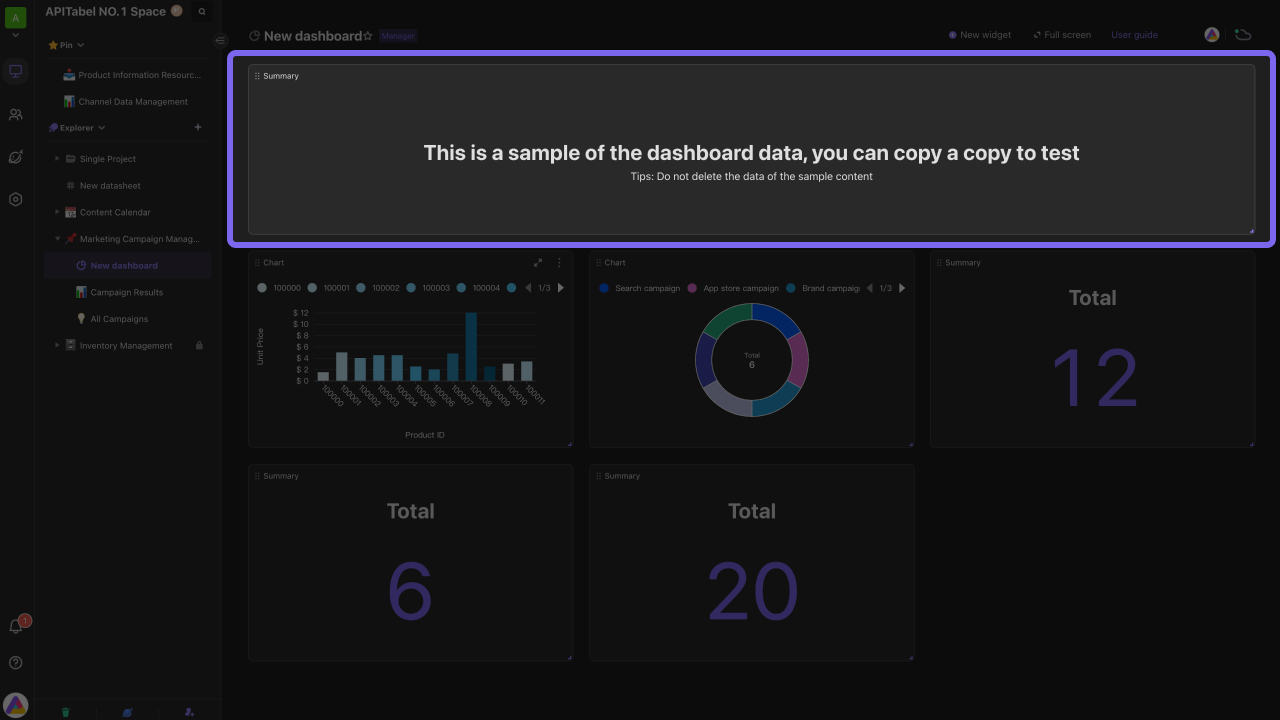
1. You can import an existing summary widget from the datasheet into the dashboard.
2. Adding a new widget is another way to have a summary widget in a dashboard.
Setting up the widget
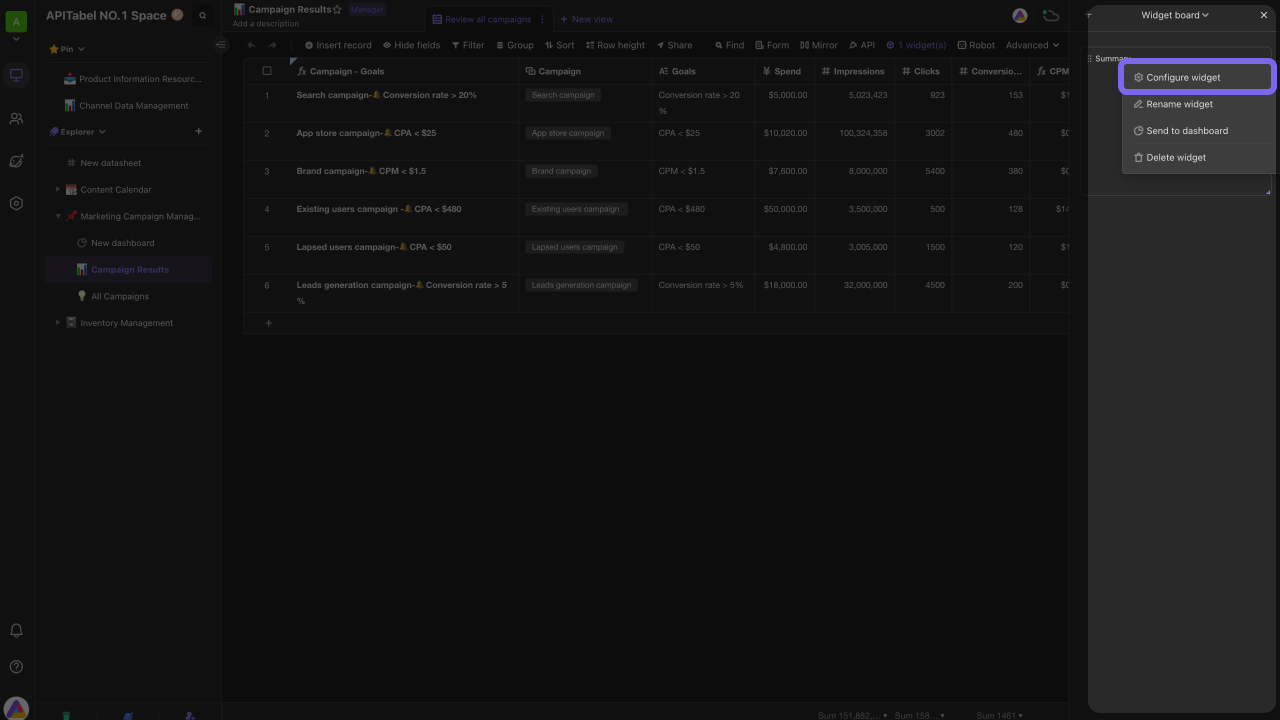
After adding a new summary widget, the system will read and display the data randomly.If you want to change the information summarized, you can open the widget settings and pick the data you want to summarize.
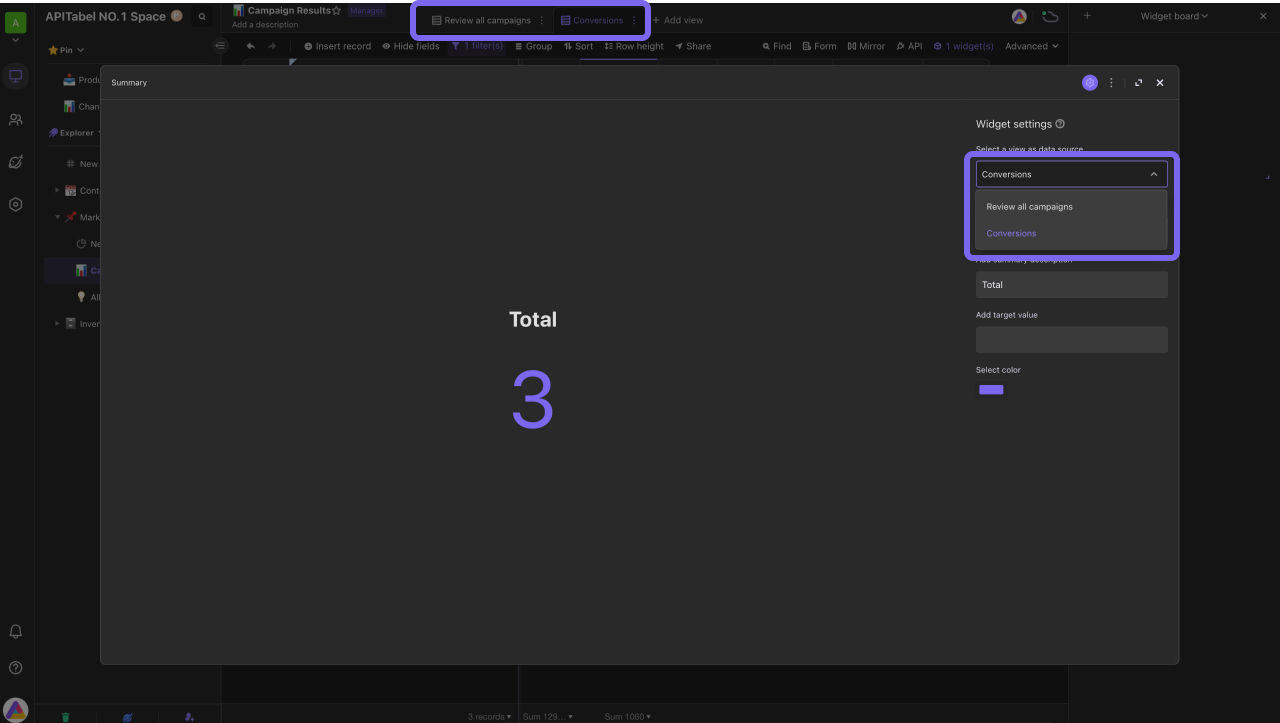
Picking a view as data source
You can select an existing view of the datasheet from the dropdown menu as data source.Filter is able to have an influence on data source.If a filter is applied on the view, some data will be filtered out and not be used for summarization.
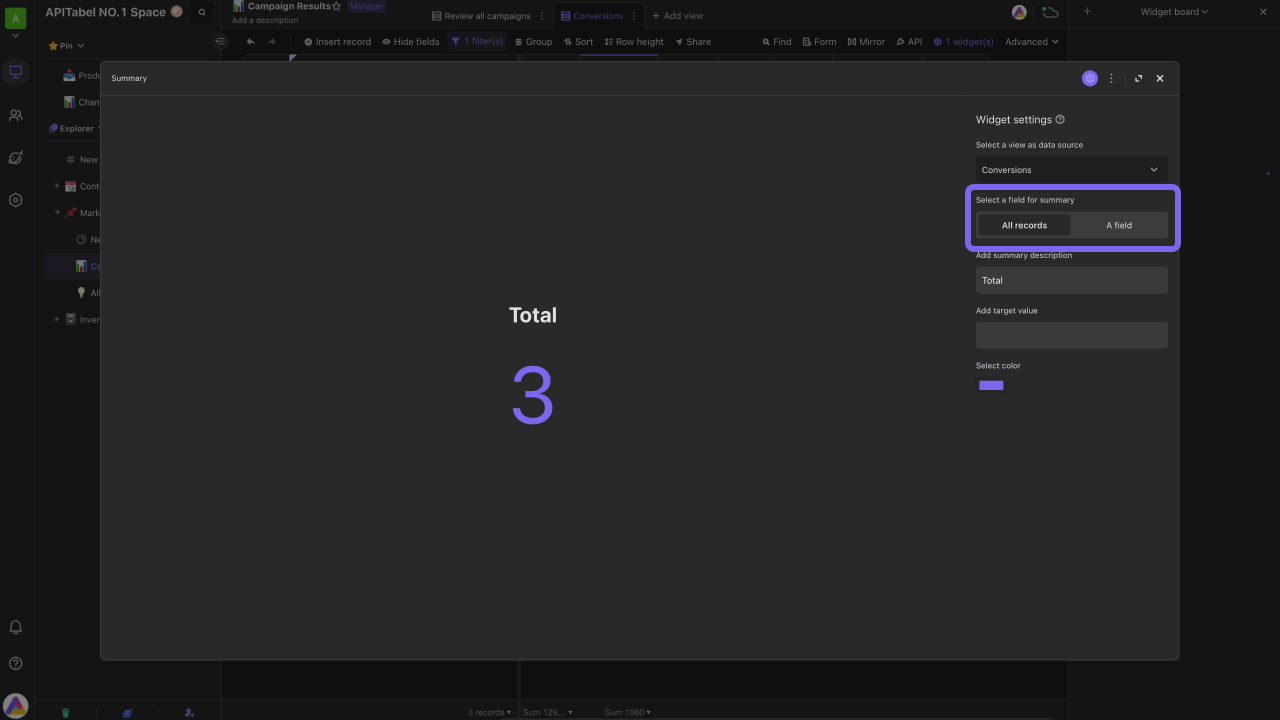
Selecting a summary type
You can choose to let your widget either count all records or summarize a specific field.
Count all records:
The widget counts the number of all records visible in the view you picked. For example, in below advertisement campaign management case, to know how many campaigns we carried out, we use summary widget to count all campaign records.
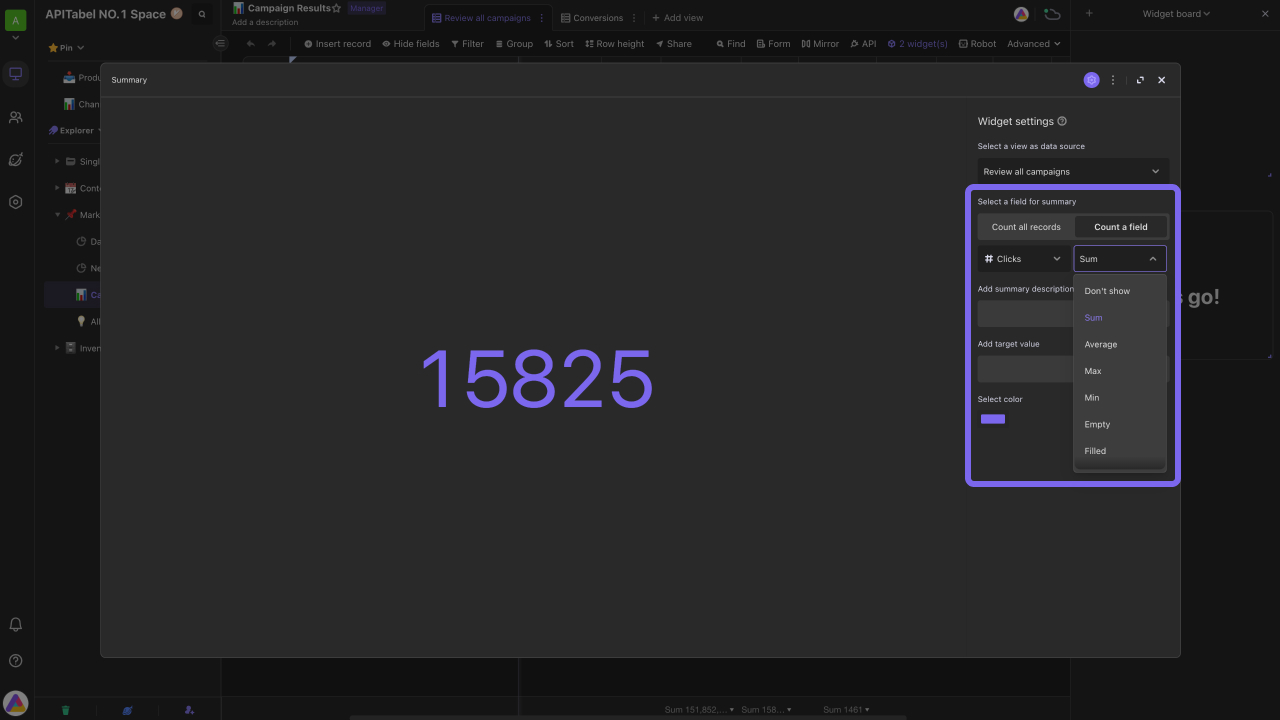
Summarize a field specified:
The widget displays the result of a summary function performed on the field you specify.
Summary functions available to be performed vary due to different types of the field. For example, the functions of sum, average, and maximum can be executed for number field, while unique, empty, and filled functions are available for single line text field.
For example, in below campaign results management case, the function used to summarize the number field - "Clicks" is sum.
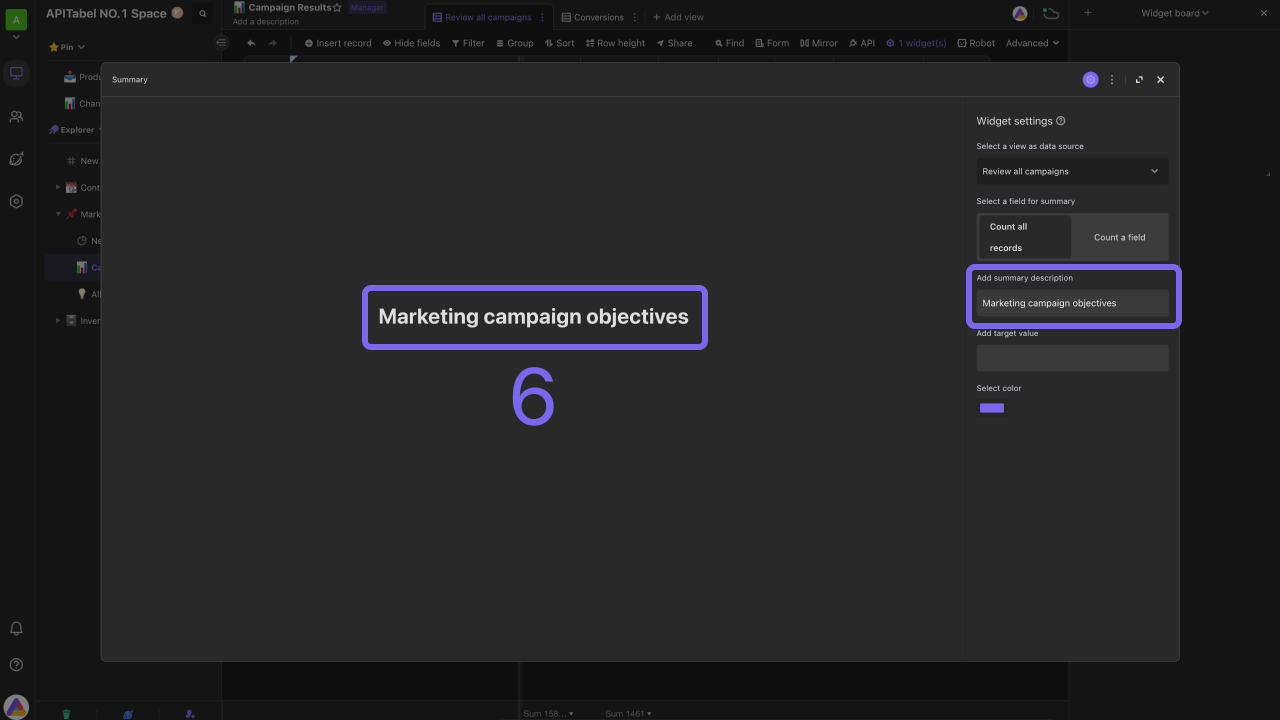
Adding descriptions on widget
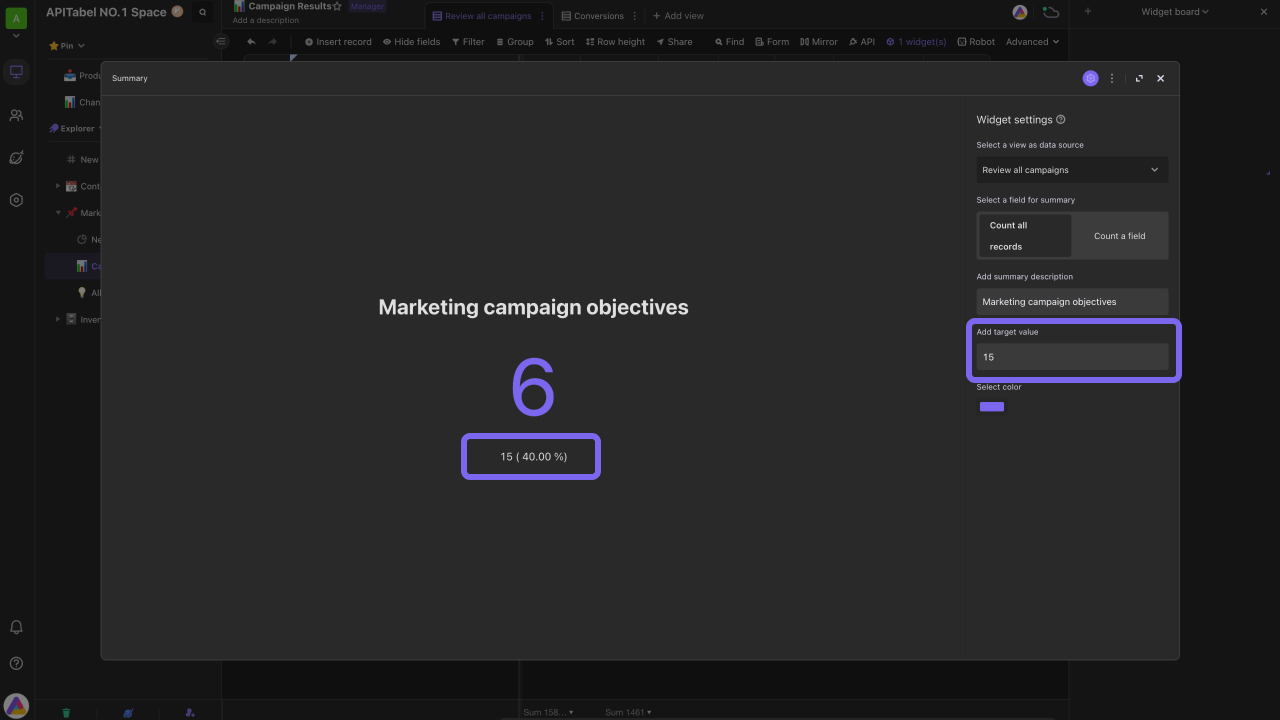
You can add a text description to explain what the summary statistic stand for.The description label is displayed above the statistic value.As shown below, the description illustrates that the summary number is "Marketing campaign objectives".
Adding a target value on widget
As the figure shows, you can add an expected target below the summary number in many cases to help you understand the difference between your data and target.When the target added is number, the widget also displays the percentage of achievement of it.
Permission of viewing the widget
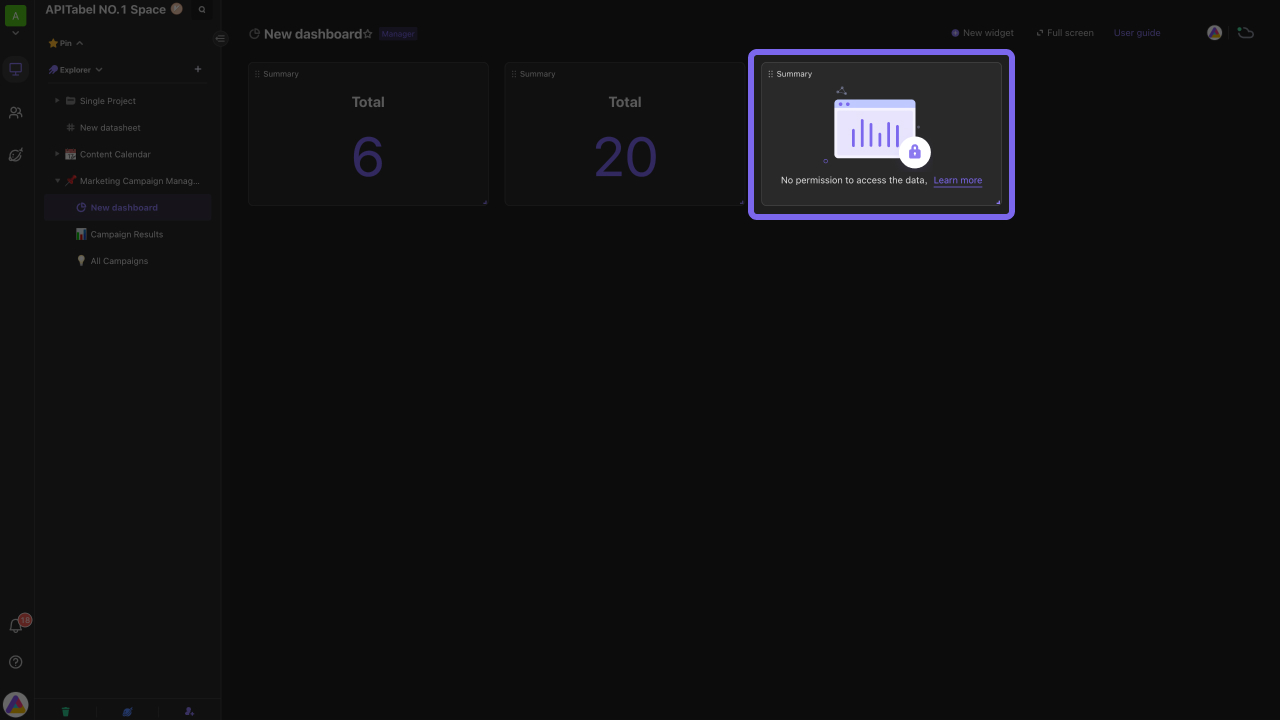
Members must have reader or above permissions of source datasheet so that they can see the data on summary widget.
For example, if a member doesn't have permission of viewing "Campaign Results" datasheet, he/she will be not able to access the summary widget based on this datasheet, and the system will notify him/her as the figure.
Other usage of summary widget
Another special usage of summary widget is to use it as a white board, as shown below.
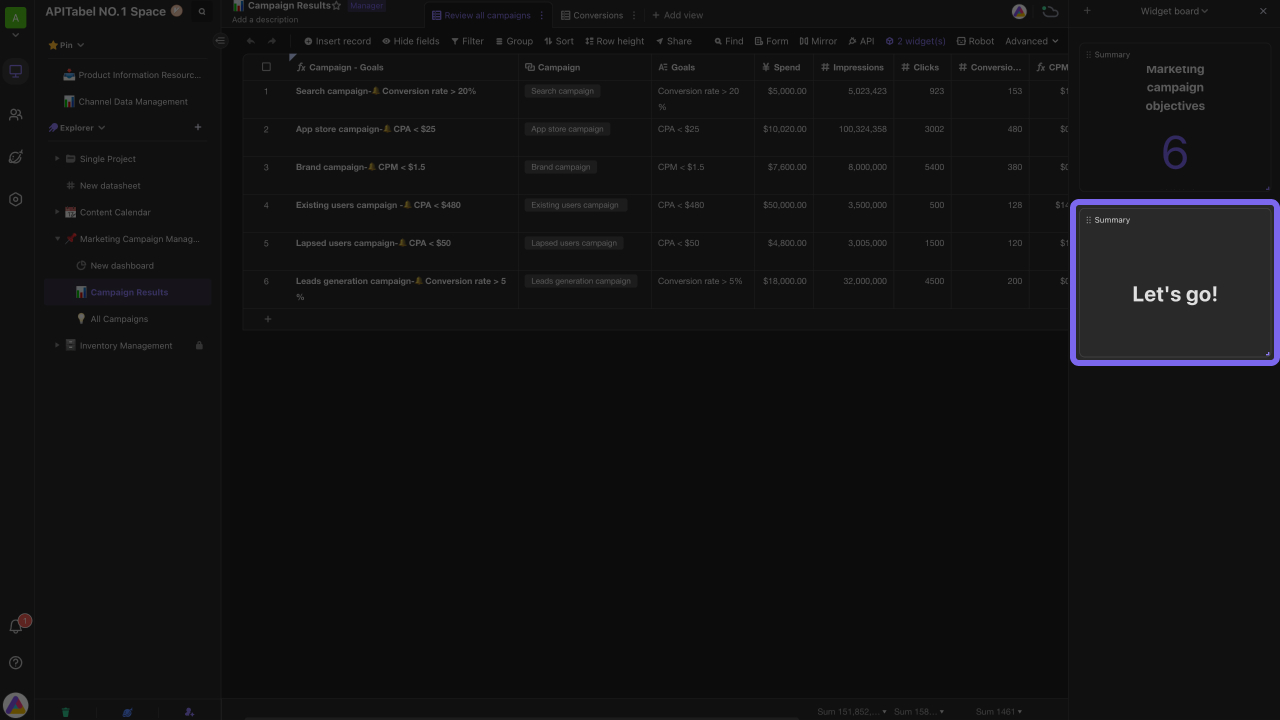
So how to use it in this way?Firstly, set the widget to summarize a specific field, and then pick "Don't show" from dropdown menu that lists summary functions, making no summary value displayed on the widget. Lastly, add a description on the widget. Your widget then becomes a notice board.