Pivot Table Widget
The pivot table widget (hereinafter pivot table) is a powerful tool for quickly calculating, summarizing and analyzing data.
Use cases
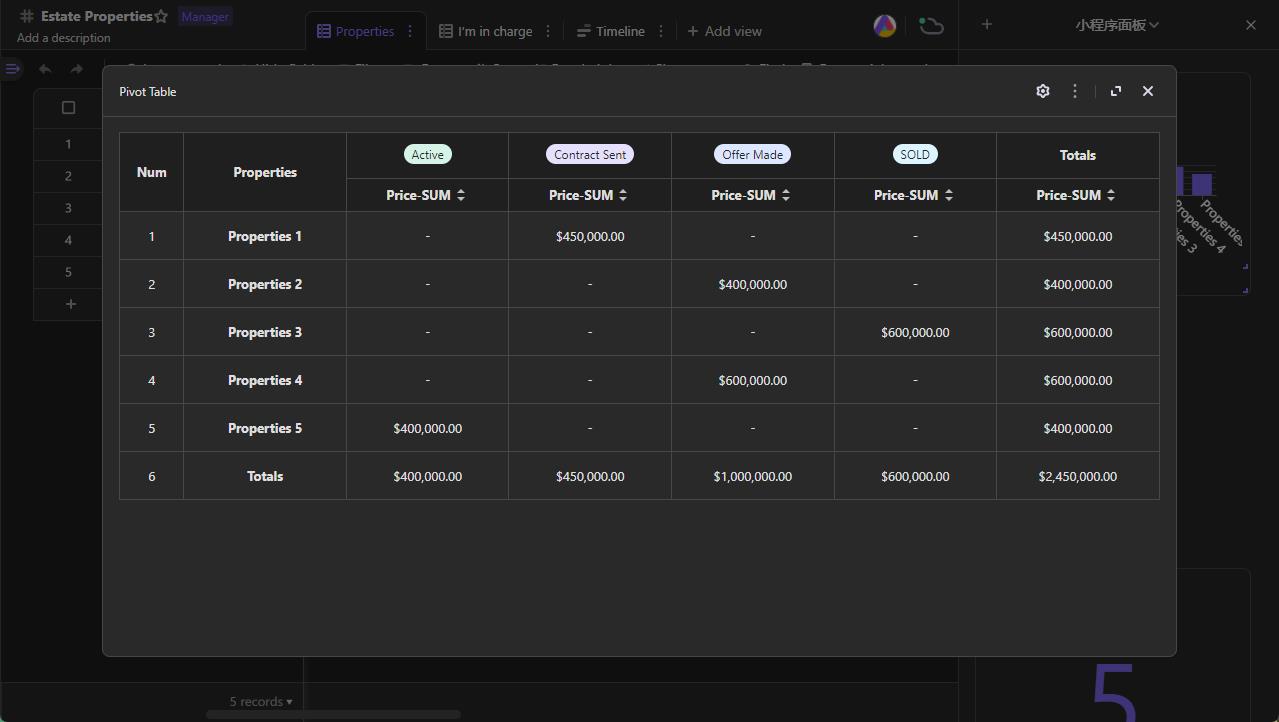
- Use case 1: to store sales data in store management case
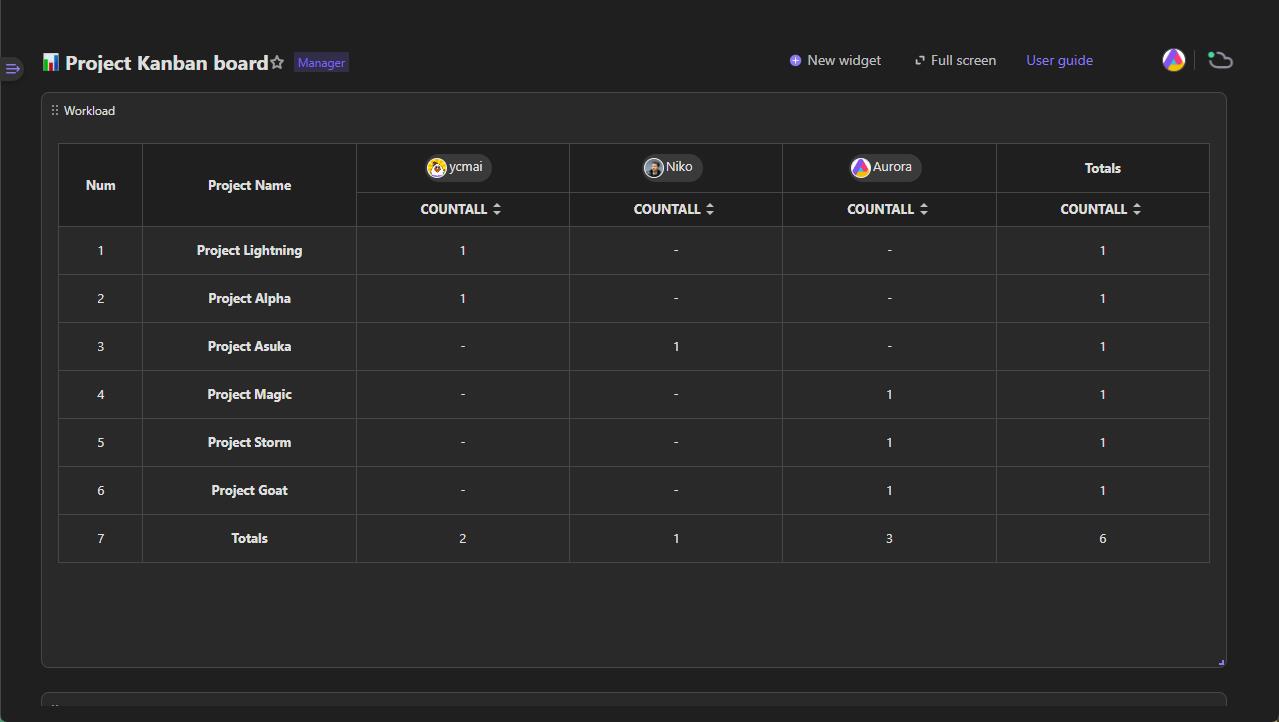
- Use case 2: count the number of personal tasks in project management case
- Use case 3: to record inventory information in inventory management case
In summary, as long as you want to summarize your data with categories, pivot table is a very useful tool.
## Adding a pivot table
- Method 1
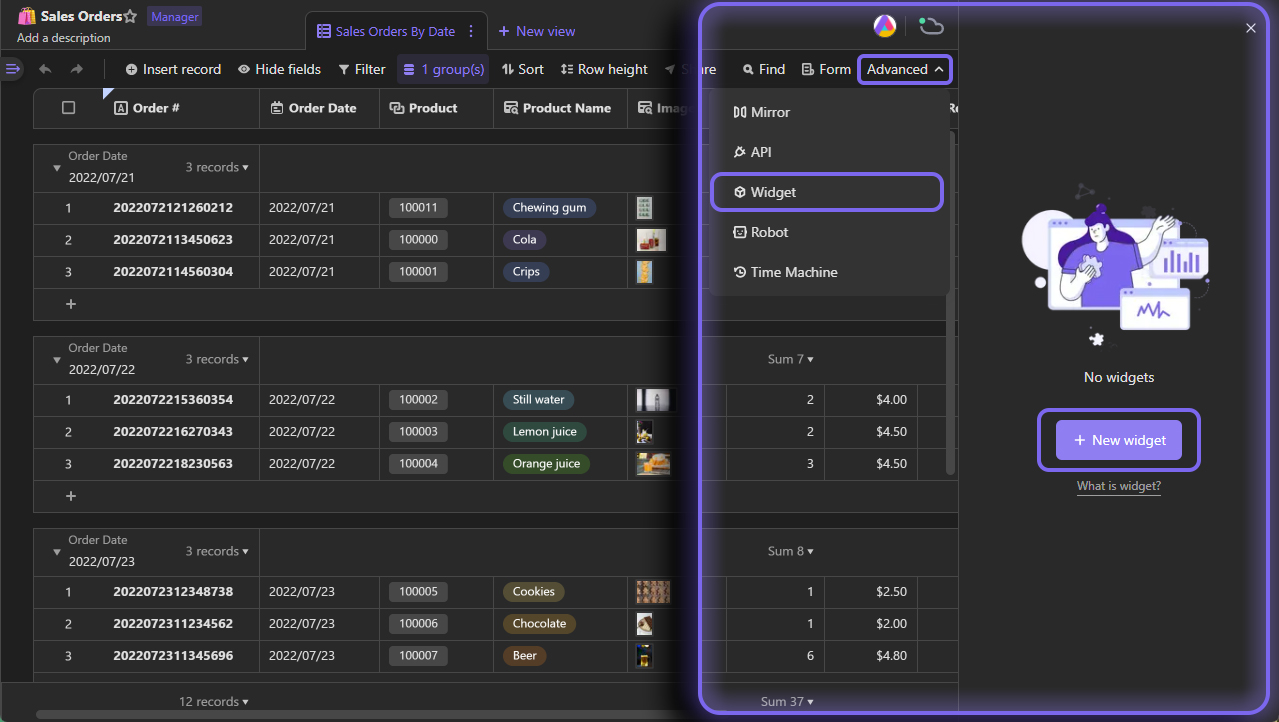
To add a pivot table, open a datasheet and click the "Widget" button in the right top corner of the datasheet to expand the widget panel, and then click "New widget" button.
- Method 2
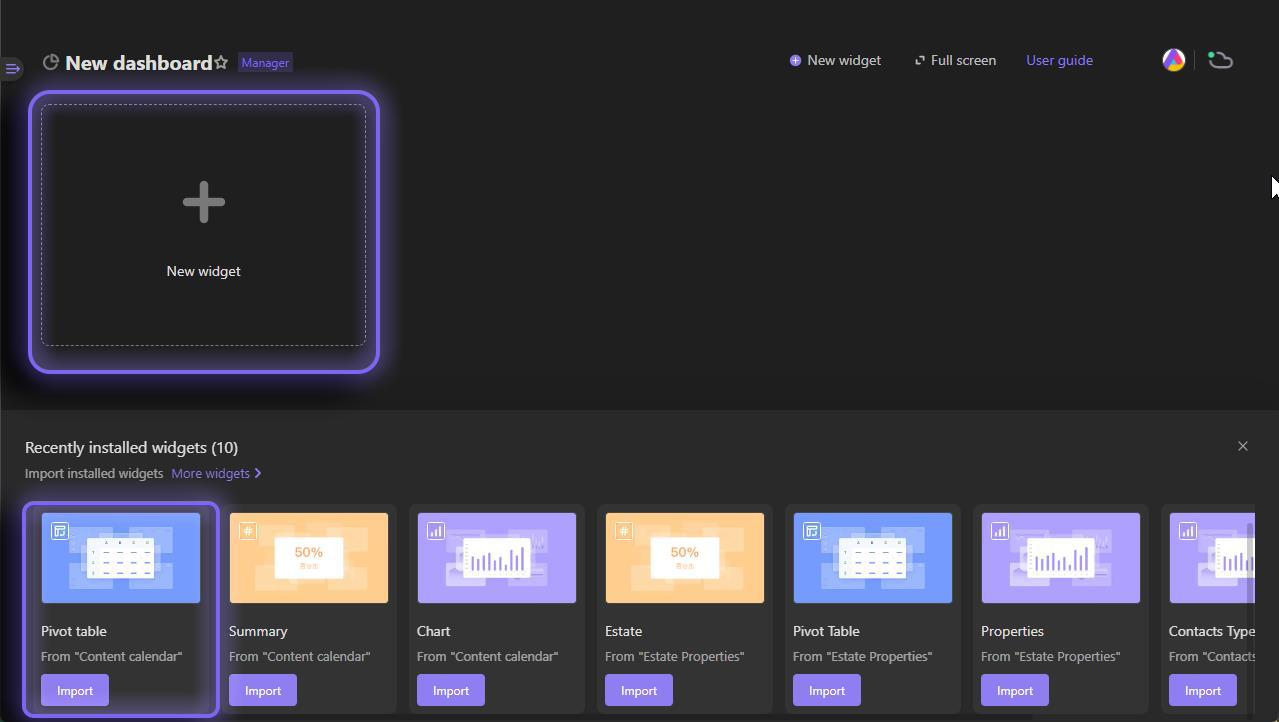
You can add a pivot table in the dashboard.
1. Pivot table added in each datasheet can be imported to the dashboard as a copy. If you've already added a pivot table on widget panel of a datasheet, you can click import button in dashboard to do so.
2. Additionally, you can click "New widget" button in dashboard to create a new pivot table.
Configuring a pivot table
Select a view as a source to provide data
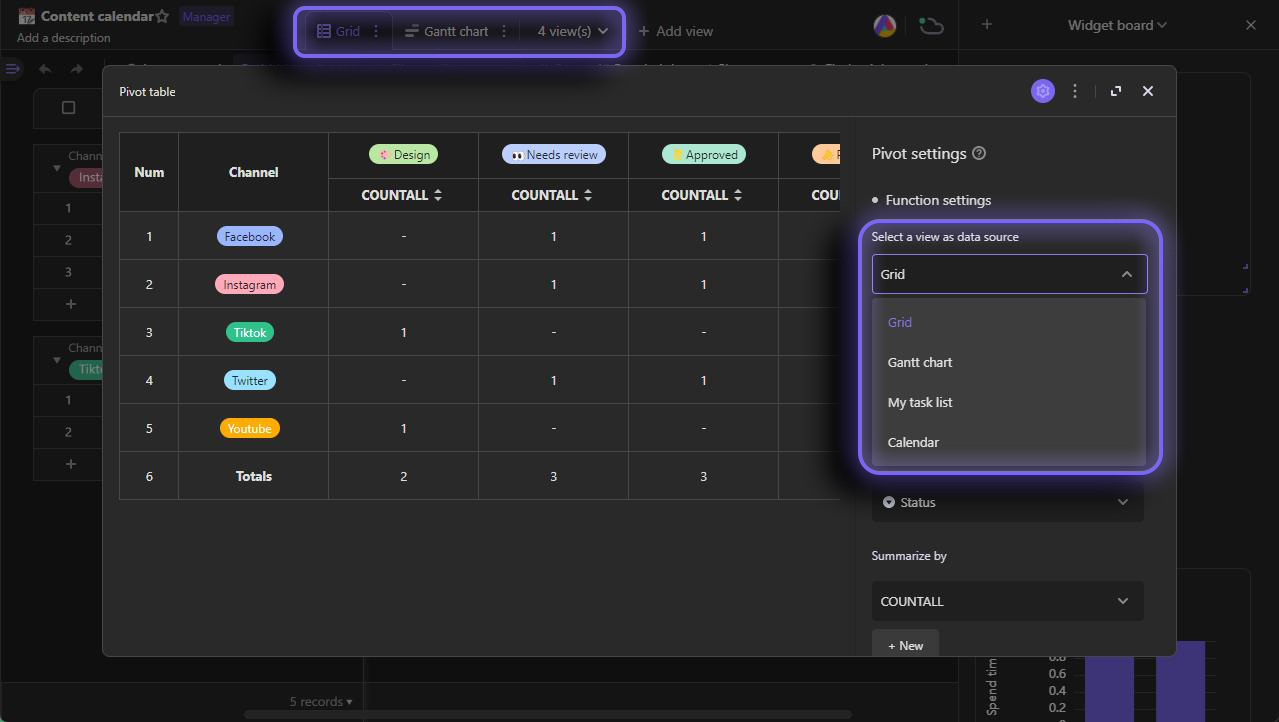
To have a data source for pivot table, you can select an existing view of the datasheet from the dropdown menu on configuration panel. The data displayed on the pivot table is affected by the filtering conditions configured, which means if some data are filtered out, they will not be represented on the pivot table.
Add a field as row label for row grouping
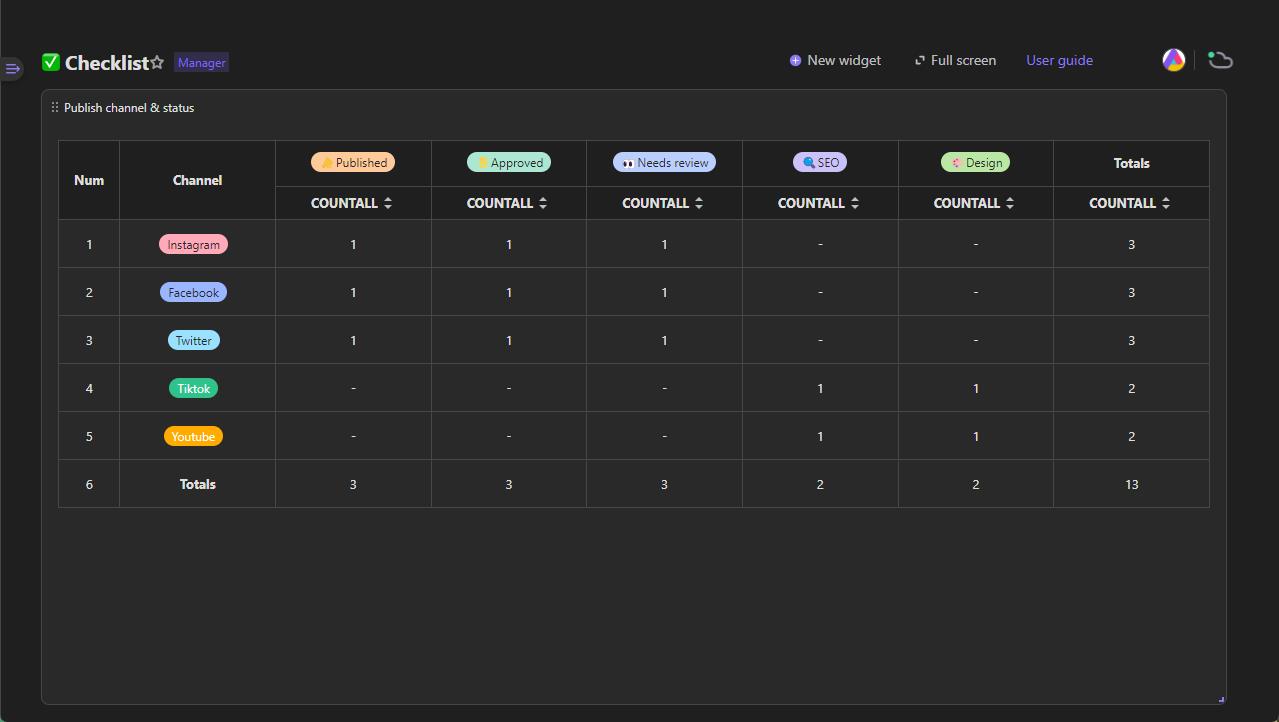
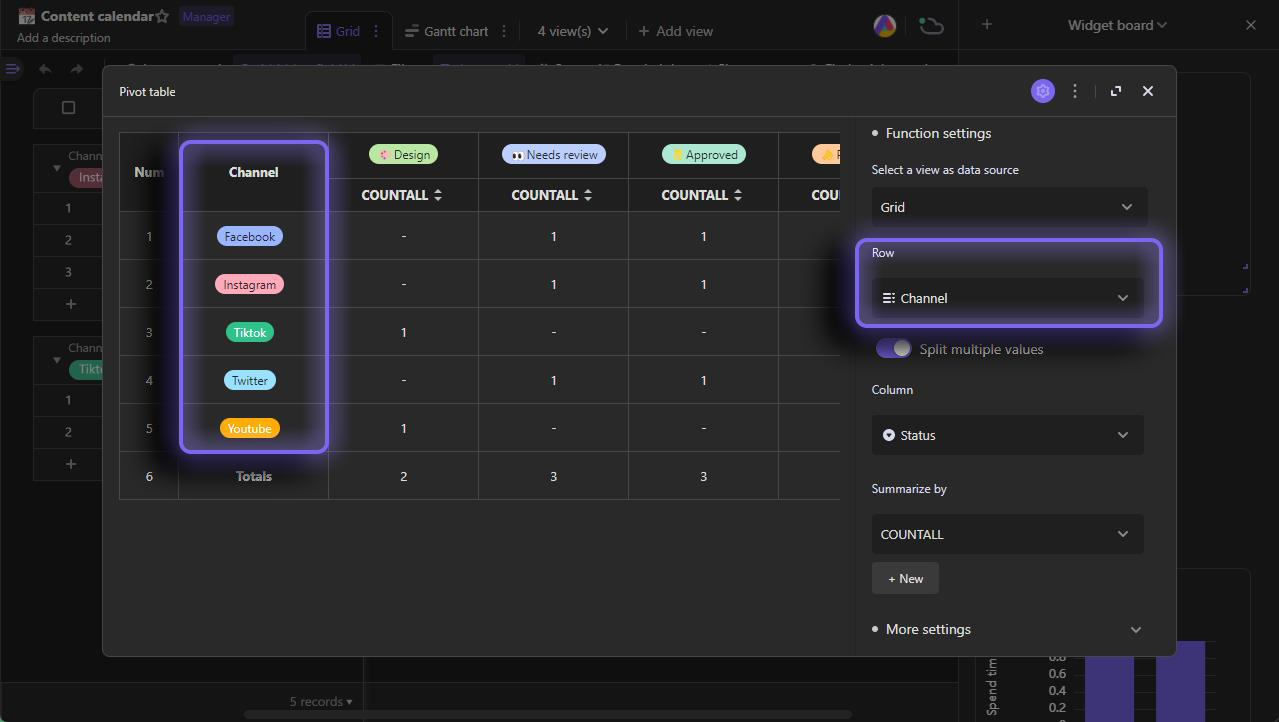
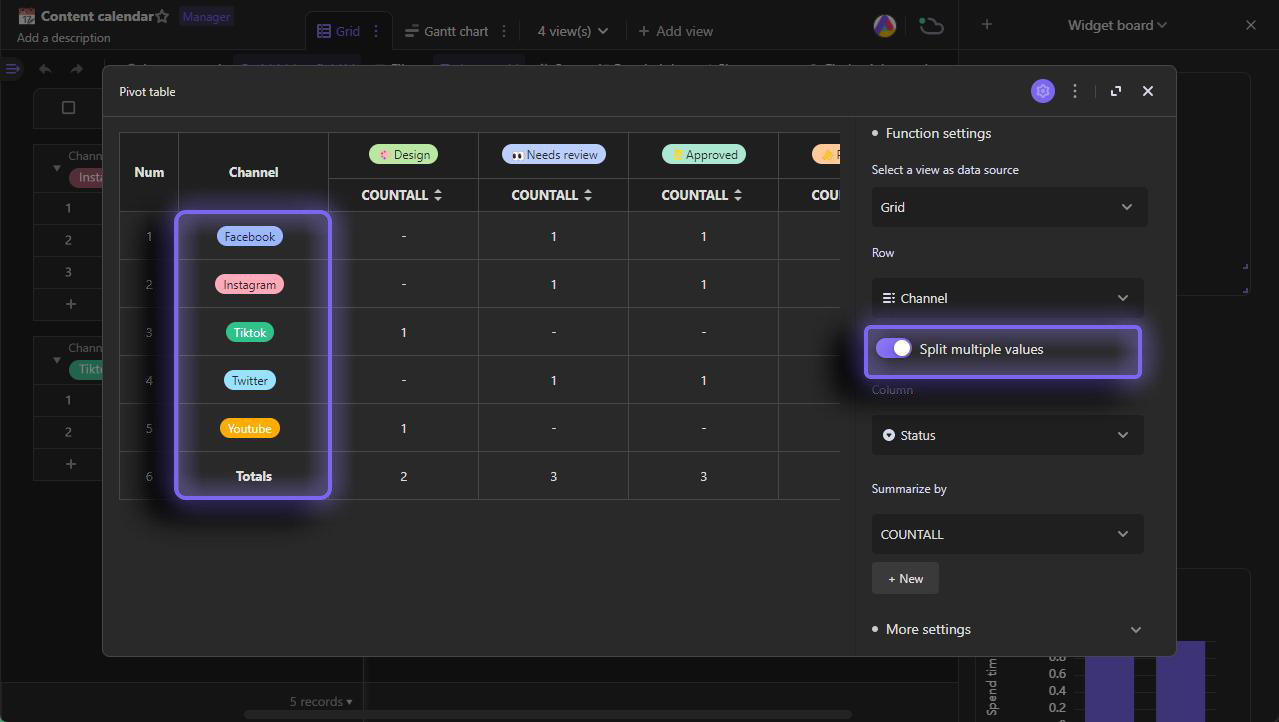
You need to select and add a field as row header for row grouping.For example, we selected and added "Channel" field into the pivot table, then it was set up as the header row for grouping rows. The contents of "Facebook", "Instagram", "TikTok", etc. are the labels for the row groups.
Currently, it is available to add only one field as row label in AITable.
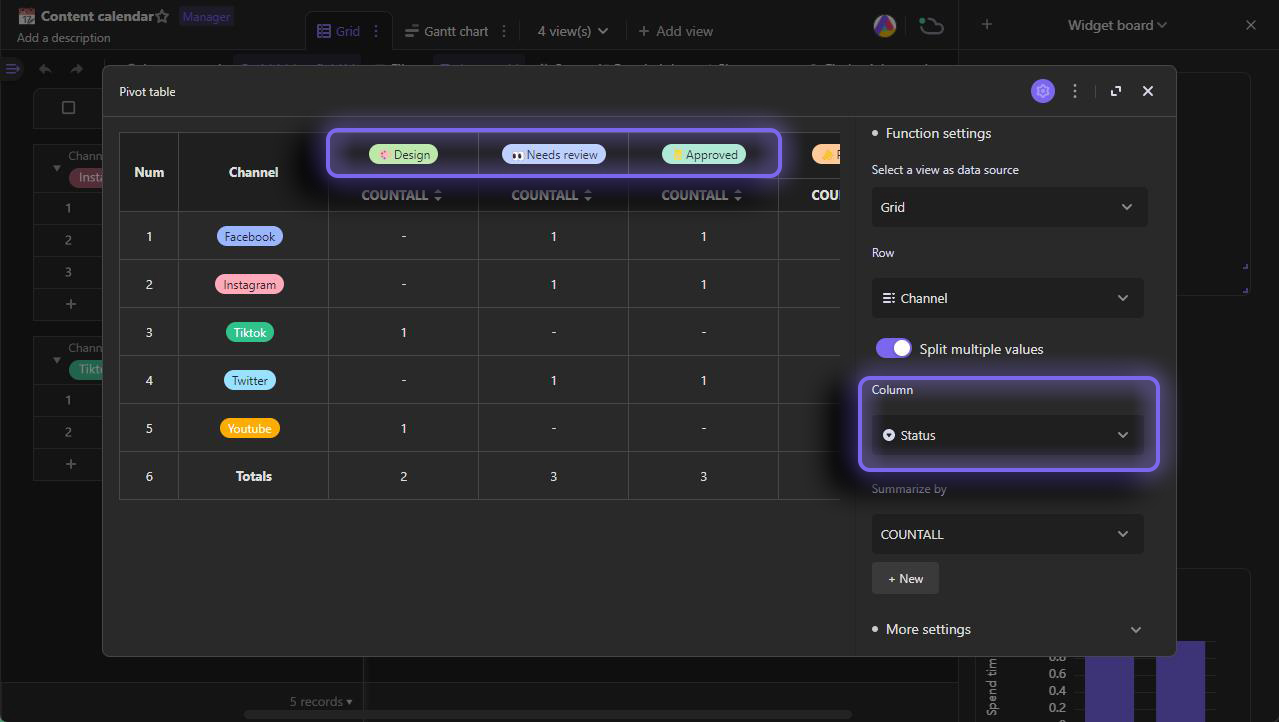
Add a field as column label for column grouping
Then you need to select and add a field as column header for column grouping.As shown below, we selected "Status" as the column header, the contents of "Design", "Needs review", "Approved", etc. are the labels for the column groups.
Currently, it is available to add only one field for grouping columns in AITable.
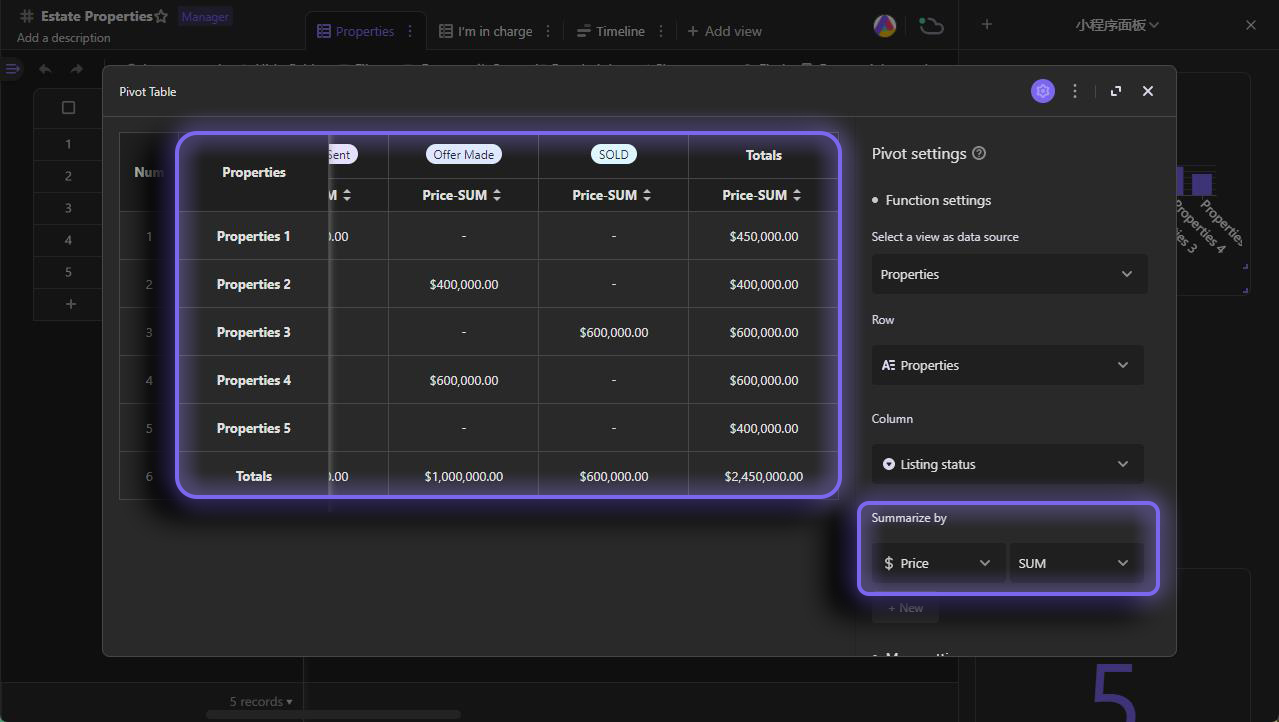
Select value field and calculation type
To summarize the data, you need to select a field to be calculated and choose the type of calculation that you want to use, such as sum, count, average, etc.
Currently, it is available to display only two types of calculation in one pivot table at the same time.
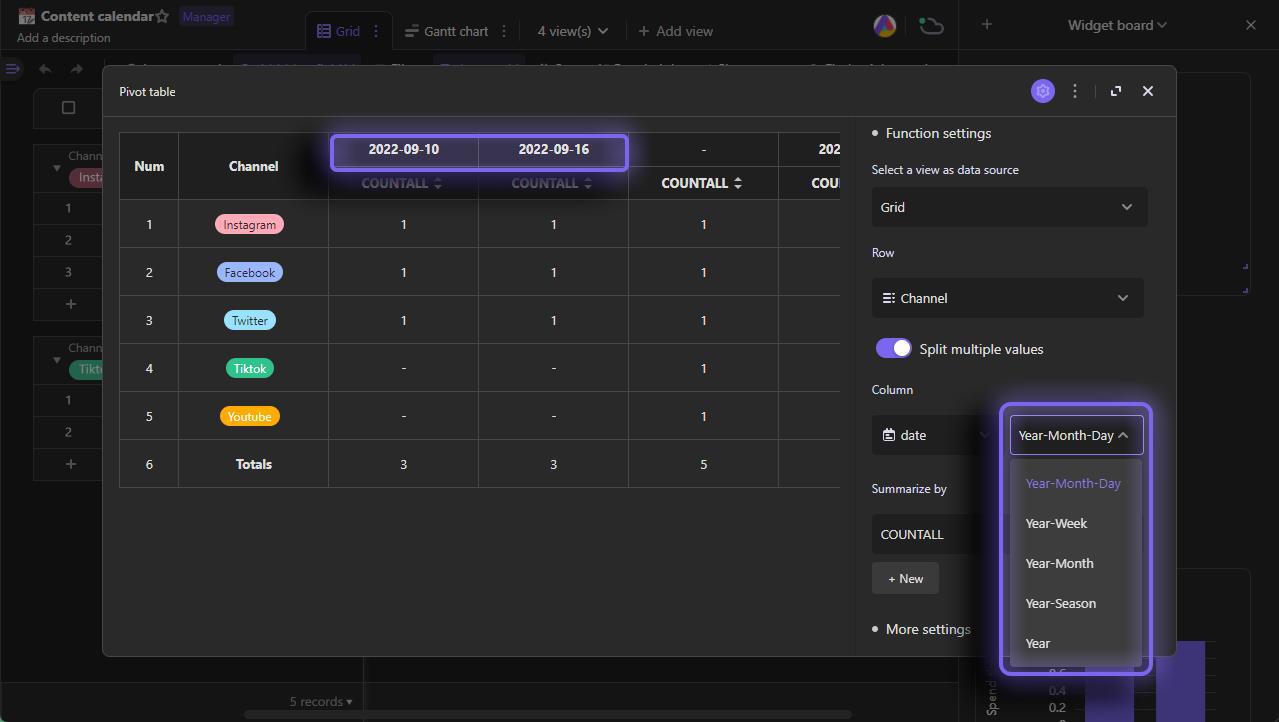
Date format specifiers
If the header row or column you selected is a field of date type, you can reformat values in the field.
For example as below, we added "date" as column header, therefore we can select to reformat the date values displayed on pivot table as one of "year-week", "year-month", "year-quarter", etc.
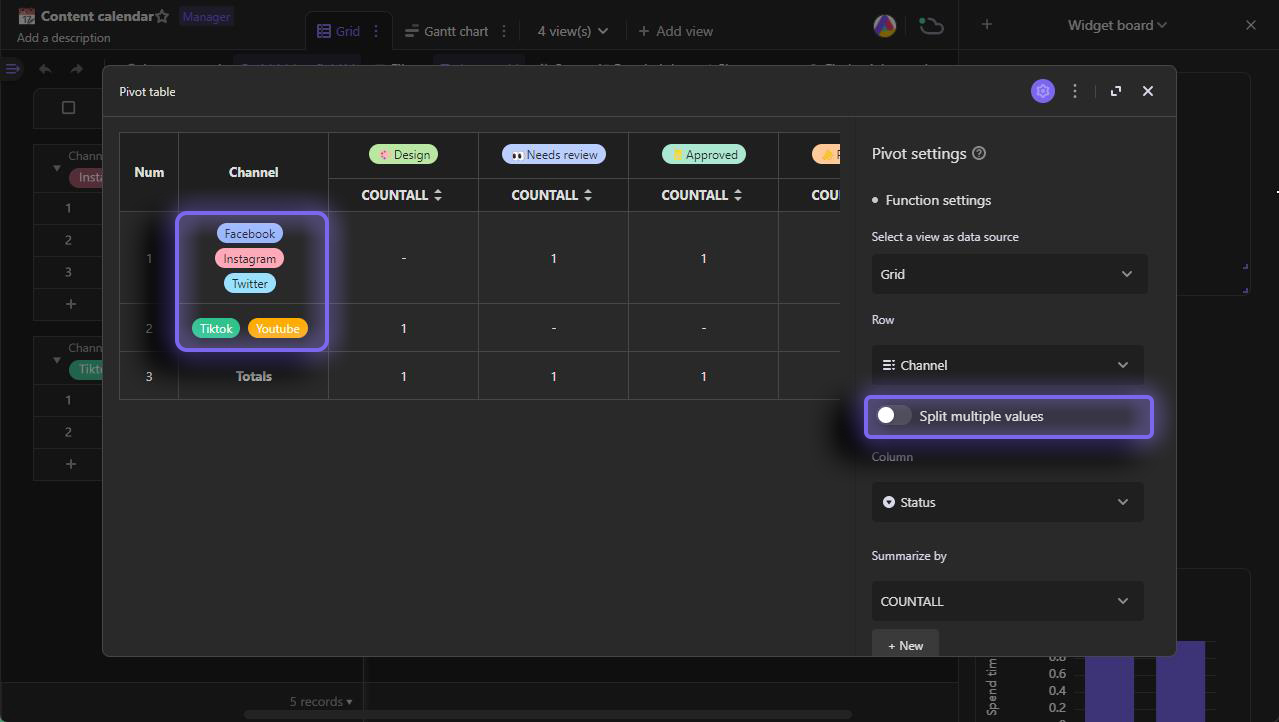
Split multiple choices
If the field you selected for row and column grouping contains multiple choices, it is optional for you to split the multiple choices, which means the field will be counted or summarized separately for each choice.Field types containing multiple choices include member, multi-select, one-way link, two-way link etc.
Show totals
With "Show totals" toggled on, you can calculate and display the totals of row and column groups on the pivot table.
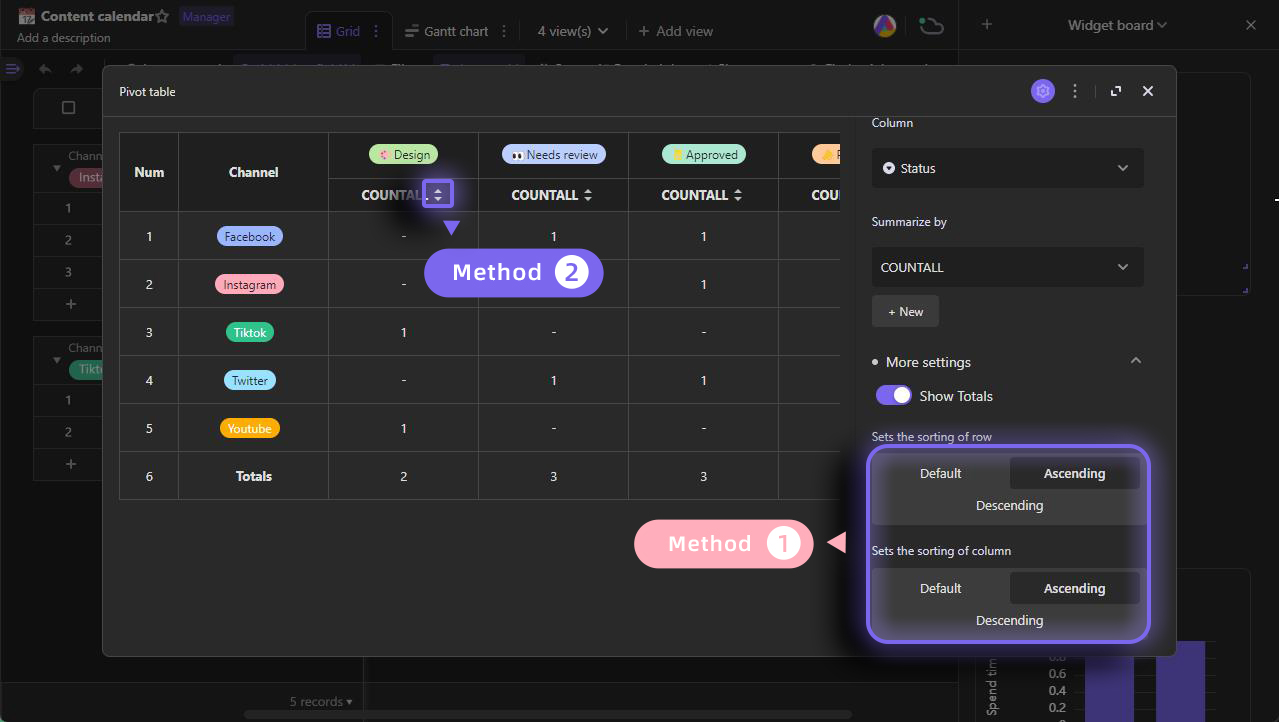
Sorting
- Method 1: You can sort your row and column groups in pivot table by clicking the options in the right bottom corner of configuration panel.
- Sorting of row group: sort the order of data in row header
- Sorting of column group: sort the order of data in column header
- Method 2: You can also click sorting icon on the pivot table to sort.
- There are three types of sorting order.
- Default: sort values in pivot table as the order of records
- Ascending: sort text values by A-Z and number values by 1-9
- Descending: sort text values by Z-A and number values by 9-1